

When I first started putting together the idea and concept of the Production Score, there wasn’t much to it. Its stripped-down nature allowed me to simply look at stats the way they were intended to be gazed upon (and ogled at).
For the better part of baseball’s history, there was only one way to get the stats of other teams and players: the sports sections of a newspaper. It seems like a bygone era in which we perused the mid-section of a much huskier news publication (a reference to a newspaper clearly slaps an age on anyone that tries to reference it). Now we find everything we want at the drop of a dime. This antiquated verbiage is used to illustrate the point I am attempting to conjure: we needed a simpler way to see what was going on in the minors. In short and in my best long island accent possible “Who the Ef is hittin and who the Ef is pitchin”? This is what led to the three-year-long birthing process of the project which is now known as the Production Score.
The Production Score includes nothing but baseline stats across the board for both hitters and pitchers. I also include two metrics that are not normally brought to the forefront: “Total Batters Faced Per Inning” for pitchers, and “Pitches Seen Per Plate Appearance” for hitters.
For pitchers, this is more of a regulation stat that tells how they are able to regulate batters getting to the plate in general, which will in turn keep their WHIP and ERA down.
For hitters, the “Pit/PA” metric provides a bit of context to how their plate appearances are going and if they make the pitcher work or not. The metric will potentially be affected by a player who is a first-pitch contact-style hitter.
All in all, the Production Score is an embodiment of its own name, just straight production baby!
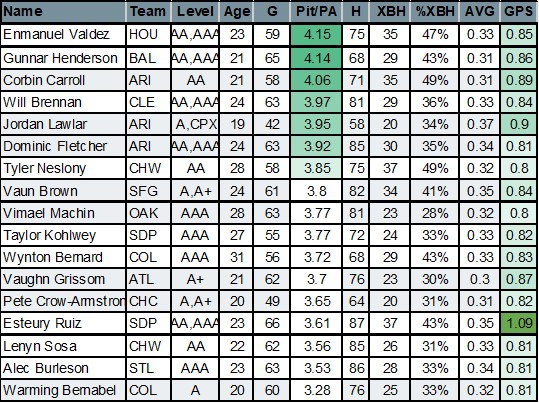
Now that we have that bit of context out of the way, we can dive right into the top performers at each level Single-A to Triple-A. The breakdowns will include players’ stat lines, production score, game production score (production score/games played), minor league ranking based on production, and a brief write-up for each player. I will also include a GPS (game production score) Scale which will provide a simple look at how their GPS profiles to current Major Leaguers. The GPS also helps to determine whether a player is just compiling stats or producing every single game. So whereas PS (production score) allows you to see their overall season stat line, the GPS shows their per-game performance.
The following MLB GPS (Game Production Score) Tables were created using the same calculation used to create the Minor League GPS scores. There will be a total of three charts, Hitting, Starting Pitching and Relief Pitching. These charts were based off data that was current as of Monday, June 27, 2022. This must be noted however and there will be a disclaimer below, GPS comparisons (although they are interesting) cannot be taken as a direct One to One comparison. MLB stats do not equal MiLB stats. However certain key factors due indicate a player’s performance and that is where filters come into play.
There will be two sets of filters that I go into after showing the GPS comparison. There will be a total of three things shown in this article to display its features and abilities. There will be the Production Score Sheet, The breakdown of PS (production score) and GPS (game production score). Plus, I will also cover how PS and GPS are utilized, and finally discuss the sorts and filters I use in order to find players throughout all levels of MiLB.
*Disclaimer*
Just because the player’s GPS might mirror a Major Leaguer’s current GPS, it does not indicate that said minor leaguer would produce the same way in the Majors. It is strictly for context; it allows you to decide if that player is outproducing their current prospect ranking based on their current production.
| Major League Hitting Examples of a GPS grading (game production score) | ||
| S Tier – All World | Greater than 1.1 | One Player – Shohei Ohtani |
| A+ Tier – Obvious All-Star | 1.0 to 1.09 | Two Players – Paul Goldschmidt & Jose Ramirez |
| A Tier – All-Star | .9 to .99 | Ten Players – e.g., Bryce Harper, Aaron Judge, Manny Machado |
| B+ Tier – Borderline All-Star | .8 to .89 | Eighteen Players – e.g., J.D. Martinez, Trea Turner, Freddie Freeman |
| B Tier – Above Average | .7 to .79 | Sixty-One Players – e.g., Luis Robert, Christian Yelich, Jeff McNeil |
| C Tier – Average | .6 to .69 | Ninety-Eight Players – e.g., Jared Walsh, Alex Verdugo |
*It’s important to note that the above grades were based on current production levels as of 6/27/2022 and are not directly correlated to past or future performance.
| Major League Starting Pitching Examples of a GPS grading (game production score) | ||
| S Tier – All World | Greater than 4 | Three Players – Shane McClanahan, Joe Musgrove, Max Scherzer |
| A+ Tier – Obvious All-Star | 3.49 to 3.99 | Eleven Players – e.g., Corbin Burnes, Sandy Alcantara, Alek Manoah |
| A Tier – All-Star | 2.99 to 3.48 | Twenty-Three – e.g., Nestor Cortes, Yu Darvish, Dylan Cease |
| B+ Tier – Borderline All-Star | 2.49 to 2.98 | Thirty-Three – e.g., Tarik Skubal, Zac Gallen, Shane Bieber |
| B Tier – Above Average | 1.99 to 2.48 | Sixty-Eight – e.g., Zach Plesac, Paul Blackburn, Corey Kluber |
| C Tier – Average | 1.98 and Below | Everyone else – e.g., Erick Fedde, Dylan Bundy, Glenn Otto |
*It’s important to note that the above grades were based on current production levels as of 6/27/2022 and are not directly correlated to past or future performance.
| Major League Relief Pitching Examples of a GPS grading (game production score) | ||
| S Tier – All World | Greater than 2.20 | One Player – Josh Hader |
| A+ Tier – Obvious All-Star | 2.00 to 2.19 | Seven Players – e.g., Ryan Helsley, Clay Holmes, Taylor Rogers |
| A Tier – All-Star | 1.80 to 1.99 | Twelve Players – e.g., Edwin Diaz, Emmanuel Clase, Jhoan Duran |
| B+ Tier – Borderline All-Star | 1.7 to 1.79 | Five Players – e.g., Joe Barlow, John Schreiber, Raisel Iglesias |
| B Tier – Above Average | 1.5 to 1.69 | Twenty Seven Players – e.g., Michael Fulmer, Jordan Romano, Ryan Pressly |
| C Tier – Average | 1.5 and Below | Everyone else – e.g., Seranthony Dominguez, Giovanny Gallegos |
*It’s important to note that the above grades were based on current production levels as of 6/27/2022 and are not directly correlated to past or future performance.
By now you should already have the Production Score sheet open; if not, you can open that up as I’ll be using it in the following examples to illustrate its use.
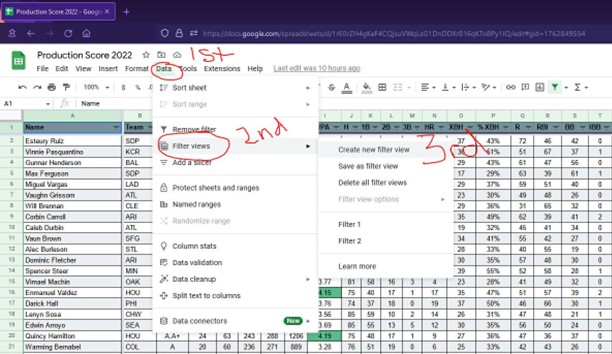
The hitters and pitchers tabs are where you will want to look next and more specifically in the top right of those tabs when either one is open. For now, you can click on hitters, and we will go over the sort & filter functions that will help you best utilize the sheet as well as the filters I use as examples.
The best way for you to filter is to click “Data” on the top bar when on the Hitters or Pitchers tab, click “filter views” in the drop down, then click “create new temporary filter view.” This allows you to sort and filter.
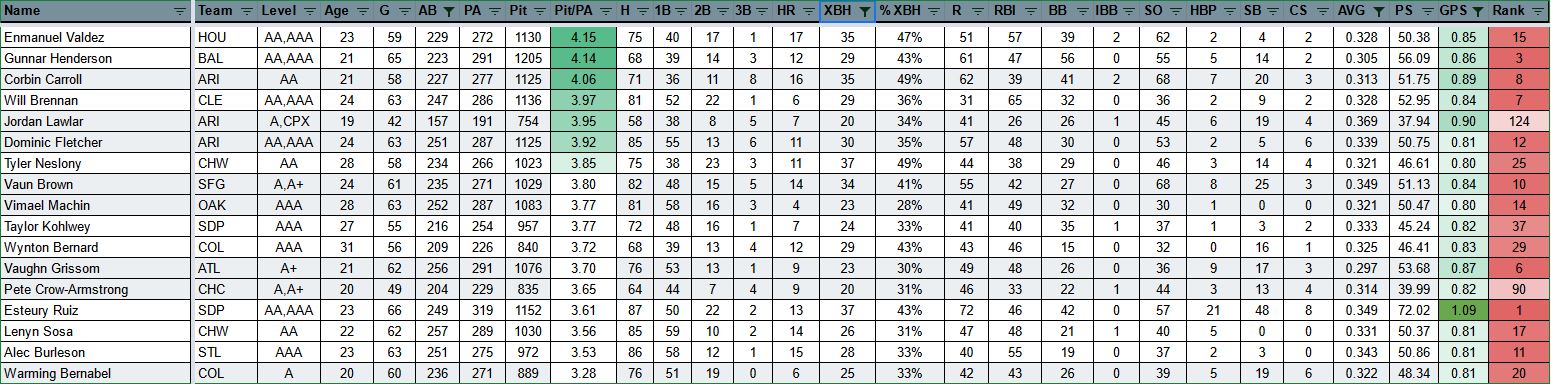
Now that we have created a temporary filter, we are able to sort the data any way that we would like to manipulate it. For me, I would utilize the following filter for hitters which I am tweeting every week and I call it the “Hitting Short List”.
The filters I use for the HSL (hitting short list) and why is listed below:
*You can apply these filters by clicking the slash lines then selecting filter by condition, then selecting the drop downs accordingly. (All selections here are Greater Than or Equal to)
- Ordered By Highest Pit/PA (Pitches Per Plate App) – How patient and if they work an at-bat
- Greater Than or Equal to > 150 AB (At Bats) – they Played enough to get knowledge from this sample size
- Greater Than or Equal to > .285 BA (Batting Average) – they are hitting at a high clip
- Greater Than or Equal to > .80 GPS (Game Production Score) – producing bases and runs
- Greater Than or Equal to > 20 XBH (Extra Base Hits) – Multiple Bases on hits
Now if you cross-reference this filter with the graph listed above, you will have noticed that we are using .80 GPS because it is how a Borderline All-Star performs at the major league level. These filters are applied because it gives us everything, we need to make an informed decision on prospect evaluations at the top statistical portion of the minors by gathering our 5 key factors. I am looking for players that see pitches, that have seen at-bats, that are hitting during those at bats, producing bases and runs in those at bats, and lastly hitting for multiple bases.
This Sort and Filter produces a list with only 17 players on it. This would be the short list I first use to find prospects that I can add in my Fantasy Leagues using the sort and filter functions.
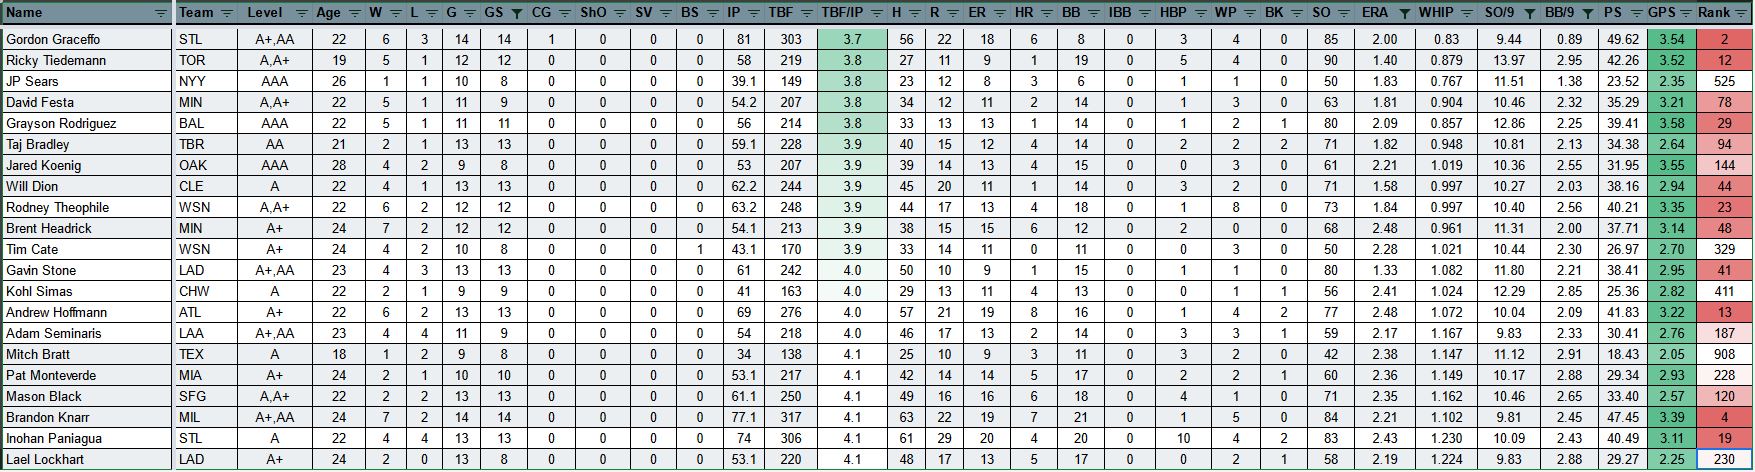
This list is what I also tweet out weekly the PSL “Pitching Short List”. Filters Below:
- Ordered by TBF/IP (Total Batters Faced Per Inning Pitched) – Regulates batters at the plate
- Less Than or Equal to < 2.50 ERA (Earned Run Average) – Doesn’t allow runs
- Less Than or Equal to < 3.00 BB/9 (Walks Per Nine) – Doesn’t give up walks
- Greater than or Equal to > 9.00 SO/9 (Strikeouts Per Nine) – Can get a strikeout
- Greater than or Equal to > 8 Starts – Has Started enough games for sample size
These filters are applied for the same reasons we applied using the hitting filters, we are finding five key factors that can indicate future performance. Keeping batters off the plate, keeping runs off the board, not allowing walks, striking people out, and lastly actually pitching.
This filter list would pull back only 21 pitchers in which I would use to add players.
In closing, the reasons for using the sheet should be sufficiently evident. If for nothing else, it houses a lot of useful information. This information can easily pull up top-producing players to form a sample size in which other players can be seen as contemporaries. If the scouting process or evaluation process has overlooked certain players, then this statistical analysis can be used to find overlooked players which still provide value and should now be considered more valuable based on their production.
There will always be new metrics, new analyses, computer models, and whatever else comes out with new bells and whistles. Sometimes, you just want to peel open the newspaper and find an old school box score. This Production Score Metric allows you to do just that by seeing all minor league baseline stats, ranked and sort-able, right at your fingertips.
@TheRealNaClown on Twitter
Creator of Production Score Metric │ Fantasy Baseball Advisor │ Top 5's - All Levels Weekly.
Host of @ProScorePod │ Special Contributor @Prospects1500
this is a pretty useful tool, thank you for putting this together